Productivity Tracker: How They Work, What They Measure, and How to Choose One
Track Nexus Editorial Team
Workforce Productivity Experts
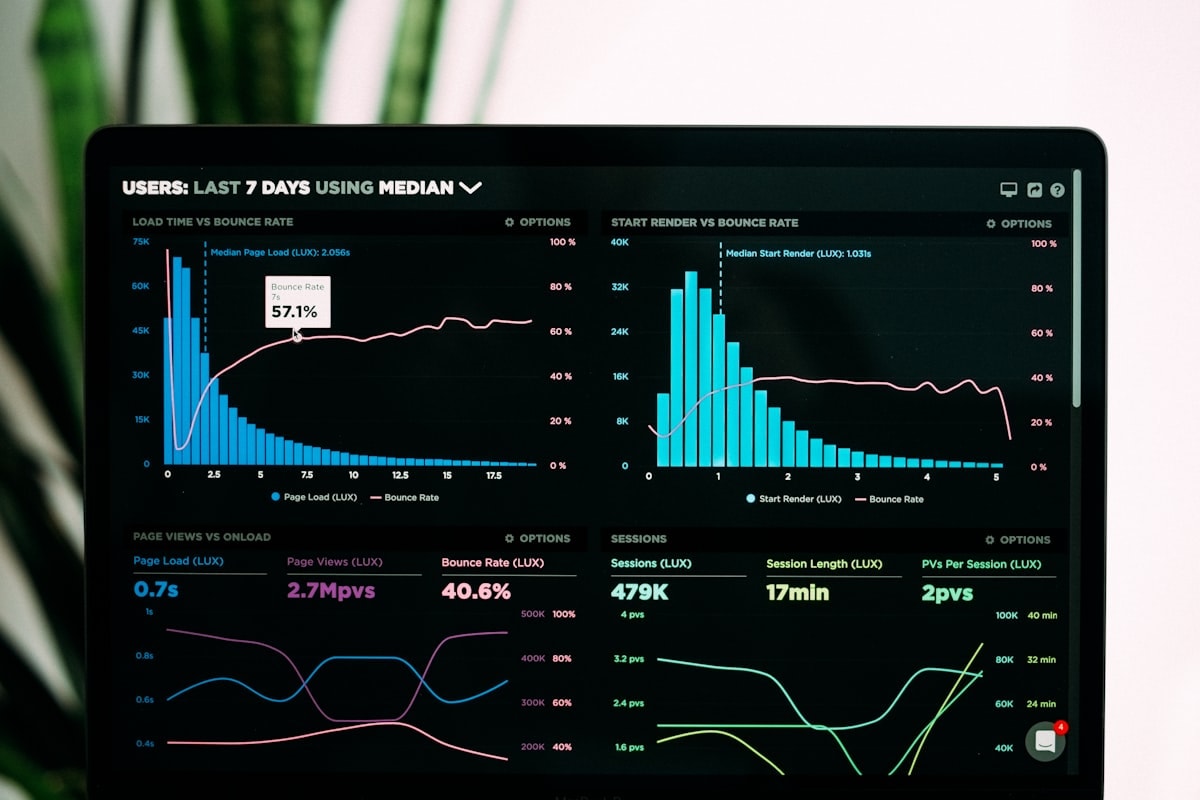
A productivity tracker is software that records how work time is actually spent — across applications, documents, projects and locations — and turns that record into something a manager can act on. That is the easy part to explain. The hard part, and the reason so many rollouts fail, is that 'productivity' is not a single number the software can read off a sensor. It is an inference built on top of raw activity data, and the quality of that inference depends entirely on what the tool measures and what you ask it to mean. This guide covers what these tools genuinely capture, the arithmetic behind the dashboards, where the measurements break down, and how to evaluate a tracker for a real team. It is written for the person who has to choose one and then defend that choice to both a finance director and the people being tracked.
What a Productivity Tracker Actually Measures
Almost every productivity tracker on the market captures some combination of five signal types. Knowing which ones a tool collects tells you more about it than any feature list.
Time-in-application. The foreground window, how long it held focus, and often the document title or browser URL. This is the backbone of nearly every tracker and the most reliable signal available.
Input activity. Keyboard and mouse events — usually counted, not recorded. Counting keystrokes tells you someone was present at the machine. It tells you nothing about whether the work was good, and treating it as an output measure is the single most common way teams lose trust in a tool.
Idle and away time. Gaps where no input occurred. Every tracker draws this line somewhere, typically between three and fifteen minutes, and the threshold matters enormously for knowledge workers who read, think, or spend the afternoon on calls.
Project and task attribution. Which client, ticket or cost centre the time belongs to. This comes either from the person selecting a task, or from rules that map applications and documents onto projects automatically.
Contextual signals. Location for field teams, attendance events for shift work, calendar occupancy, screenshots or screen recordings where policy allows.
What none of these measure is output. A tracker can tell you a developer spent six hours in an IDE. It cannot tell you whether those six hours shipped a feature or chased a bug that turned out to be a typo. Any vendor implying otherwise is selling you a proxy and calling it a result. The useful mental model: a productivity tracker measures where effort went, and you supply the judgement about whether that was the right place for it.

How Productivity Trackers Work Under the Hood
Understanding the plumbing helps you predict where a tool will be accurate and where it will quietly mislead you.
Capture. A desktop agent polls the operating system for the active window, the process that owns it, and input events. On macOS this requires explicit accessibility and screen-recording permissions; on Windows it is a background service. Browser extensions add page-level URLs the desktop agent cannot see inside a single browser process. Mobile apps contribute location and clock events but far less application detail, because both iOS and Android sandbox that information deliberately.
Categorisation. Raw records — `chrome.exe / docs.google.com/spreadsheets` — are mapped to a category such as 'Productive — Documentation'. Older tools ship a static category list and make an administrator maintain it. Newer ones classify by role, so that Figma counts as productive for a designer and as a distraction for a payroll clerk, and learn from corrections instead of requiring a rule for every application.
Aggregation. Events are rolled into intervals, idle time is subtracted according to the configured threshold, and the result is attributed to projects. This is where two tools looking at identical behaviour produce different numbers: they disagree about idle handling, about whether meetings count, and about whether a 40-second Slack check breaks a focus block.
Presentation. Dashboards, scheduled reports, exports to payroll and billing.
The practical consequence is that productivity percentages are not comparable across tools, and often not comparable across teams within one tool if categories were configured separately. Treat the trend inside one consistent configuration as the signal. Treat the absolute number as decoration.
The Four Types of Productivity Tracker
The category is broad enough that two tools called 'productivity trackers' can solve completely unrelated problems. Four distinct types exist, and buying the wrong one is the most expensive mistake in this space.
1. Timer-based trackers. Someone starts and stops a timer against a task. Accurate when used diligently, useless when forgotten. Best for freelancers and agencies where the person tracking directly benefits from the record because it becomes an invoice.
2. Automatic activity trackers. A background agent records application and website use with no user action. Complete data, no memory required, but the raw output needs categorisation before it means anything. Best for teams where the goal is understanding how time is distributed rather than billing it.
3. Workforce monitoring platforms. Activity tracking plus screenshots, recordings, keystroke counts and alerting. Justified in regulated environments — financial services handling material non-public information, healthcare with patient records, BPOs contractually required to evidence controls. Disproportionate almost everywhere else, and the surveillance cost to morale is real and well documented.
4. Outcome and analytics platforms. These sit on top of tracking data and correlate it with delivery systems — tickets closed, deals moved, tickets resolved — to answer questions about capacity and profitability rather than attendance. The most useful category for leadership, and the least useful if the underlying capture is unreliable.
Most buyers think they want type 3 and are actually better served by type 2 or 4. The instinct to reach for screenshots usually signals a management problem that surveillance will document but not fix.
How to Calculate Productivity: The Formulas Behind the Dashboard
Every productivity dashboard is arithmetic on top of the captured data. Knowing the formulas lets you sanity-check what a vendor shows you.
Basic productivity ratio
`Productivity = Output ÷ Input`
Output is whatever unit your business actually sells — tickets resolved, units produced, billable hours delivered. Input is labour hours. A support team resolving 340 tickets across 400 agent-hours has a productivity ratio of 0.85 tickets per hour. The number is meaningless in isolation and meaningful the moment you track it week over week.
Productive time percentage
`Productive % = (Time in productive categories ÷ Total tracked time) × 100`
The figure most trackers display on the front page. It is entirely dependent on your category configuration, which is why it should never be compared between companies. A realistic figure for knowledge work sits well below what executives expect — meetings, email and context switching are real work that most category schemes score poorly.
Utilisation rate
`Utilisation = (Billable hours ÷ Total available hours) × 100`
The metric that matters for agencies, consultancies and law firms, because it maps directly to revenue. Sustained utilisation above roughly 85% is usually a warning sign rather than an achievement — it means there is no slack for training, admin or absence.
Focus ratio
`Focus ratio = Time in uninterrupted blocks over 30 minutes ÷ Total productive time`
More diagnostic than raw productive percentage for engineering and design teams, because it exposes fragmentation. Two people can log identical productive hours while one had four clean blocks and the other had forty interruptions.
Effective hourly cost
`Effective cost = Fully loaded salary cost ÷ Hours attributed to billable projects`
The number that turns tracking data into a finance conversation. It is also the number that justifies the software: if tracking reveals that 18% of a delivery team's hours are going to unbilled scope creep, the cost of that discovery is trivial against the recovery.
One caution that applies to all of these: the moment a metric becomes a target that affects pay or standing, people optimise the metric rather than the work. Keystroke counts rise. Timers run through lunch. The data degrades precisely when you start relying on it most.
Real-Time Monitoring vs Retrospective Reporting
Trackers present data on two very different clocks, and the choice shapes how the tool gets used.
Real-time views show who is working now, on what, and where. The legitimate uses are genuinely operational: a support manager rebalancing queues during a spike, a field services dispatcher routing the nearest technician, a BPO floor supervisor holding to a staffing commitment. In these settings live visibility answers a question that a next-day report cannot.
Retrospective reporting — daily, weekly, monthly — is where nearly all the analytical value sits. Trends survive the noise of any individual day. Someone having a terrible Tuesday is not a signal; a team whose focus ratio has declined for six consecutive weeks is.
The failure mode is predictable and common: a manager discovers the live dashboard and starts watching it. Attention shifts from output to presence, people learn they are being watched in real time, and behaviour adapts to look busy. The tool ends up measuring performance of work rather than work.
A reasonable default for most knowledge-work teams is to restrict real-time views to roles with an operational reason for them, and give everyone else weekly aggregates. If your use case is understanding capacity and profitability rather than dispatching, you do not need a live feed at all — and you will get better data without one.

Tracking Efficiency Across a Team Without Ranking People
Individual productivity data is noisy. Team-level data is where the signal lives, and it is also far safer to act on.
The distinction matters because individual variation has many innocent explanations — a senior engineer mentoring juniors logs less 'productive' application time and creates more value; a designer thinking away from the keyboard registers as idle. Aggregate the same data across a team over a quarter and those distortions average out, leaving patterns you can genuinely act on:
- Process bottlenecks. One approval step consuming disproportionate calendar time across everyone who touches it.
- Tool sprawl. Six overlapping applications doing one job, each taking a slice of attention and a licence fee.
- Meeting load. The share of the week that never reaches focused work, which is usually higher than anyone estimates.
- **Capacity reality.** The gap between nominal availability and hours that actually reach delivery—typically far larger than the staffing model assumes.
- Scope leakage. Time landing on clients or projects nobody is billing.
Each of these is a management decision with a cost attached, and each is invisible without measurement. None requires ranking individuals against each other.
The practical rule that keeps a rollout alive: use tracking data to change systems, not to rate people. The first time an individual dashboard is used in a performance review, the tool's usefulness starts to decay, because everyone learns what the numbers are for and begins managing them.
Free vs Paid Productivity Trackers
Free tiers are genuinely viable for some situations and a false economy in others.
A free tracker is usually enough for a solo professional or a team under about five people, where the requirement is timers and simple reports; for trialling the concept before committing budget; and for personal time-awareness, where you are the only consumer of the data.
You will hit the ceiling when you need role-based permissions so managers see only their own team; automated payroll or invoicing exports; data retention beyond the free window, which is commonly 30 to 90 days and is a problem the day you need to substantiate an invoice from last quarter; audit trails for compliance; an administrator who can enforce configuration rather than trusting each person to set it up; or a support commitment when the agent stops reporting.
The honest arithmetic is that per-seat pricing in this category typically runs a few dollars per user per month, while the recoverable waste a tracker surfaces — unbilled hours, overtime that should have been scheduling, licences nobody opens — is usually an order of magnitude larger for any team past about ten people. The decision is rarely about the subscription cost. It is about whether you will actually act on what the data shows, because a tracker nobody acts on is expensive at any price.
If you are weighing specific free options, we have a separate breakdown of free productivity trackers and of free versus paid employee time tracking.
How to Choose: An Evaluation Checklist
Run any shortlist through these questions before a demo, not after.
On measurement
- What exactly does the agent capture, and can we turn individual signals off? A tool that cannot disable screenshots will eventually be asked to.
- How is idle time defined, and is the threshold configurable per team?
- Are categories role-aware, or does one list apply to everyone?
- Can we correct a misclassification, and does the system learn from it?
On the data
- Where is it stored, in which jurisdiction, and for how long?
- Can we export everything in an open format if we leave?
- Is there an API, or are we dependent on the vendor's report builder?
On people
- Can employees see their own data in full? If not, expect resistance, and expect it to be justified.
- Is there a visible indicator when tracking is active?
- Does it work offline and reconcile later, or does field work simply vanish?
On operations
- Does it export to the payroll and accounting systems we actually run?
- What happens when someone changes machines, or works across two?
- What is the real per-seat cost at our headcount, including the tiers we will need within a year?
On compliance
- Does the vendor support the specific regimes we operate under—and can they evidence it, rather than listing logos on a page?
The questions people skip and later regret are the export question and the retention question. Both only matter once you are committed, which is exactly why they should be asked first.
Rolling Out a Tracker Without Wrecking Team Trust
The technical deployment of a productivity tracker takes an afternoon. The organisational deployment decides whether the data is worth anything.
Say what you are measuring and why, before it is switched on. Discovering monitoring after the fact is the single most reliable way to poison a rollout, and in several jurisdictions it is also unlawful.
Give people their own data. A tracker employees can see is a tool. A tracker only managers can see is surveillance, and people respond to it accordingly. Self-visibility is also where most of the individual benefit actually comes from — very few people have an accurate picture of their own week.
Name the decisions the data will inform. 'Staffing and project pricing' is a commitment people can hold you to. 'Improving productivity' means nothing and will be read, correctly, as a threat.
Start with a narrow question. Roll out to one team with a specific problem — a project that lost money, a queue that keeps missing SLA — rather than deploying everywhere and hoping insight emerges. Company-wide rollouts with no question attached generate dashboards nobody opens.
Collect the minimum that answers the question. Every additional signal costs trust and creates a retention liability. If application categories answer it, do not enable screenshots because they were included in the tier.
Publish the boundaries in writing. What is captured, what is not, who can see it, how long it is kept, and what will never be used in a disciplinary process. Then hold to it — the first exception is the one everyone remembers.

Regional Considerations: United States, India and APAC
Productivity tracking is a compliance question as much as a software one, and the answer changes by jurisdiction. This is a summary of the landscape, not legal advice — confirm specifics with counsel in each market you operate in.
United States. Employer monitoring of company equipment is broadly permitted at federal level, with the Electronic Communications Privacy Act carrying a business-use exception. States diverge sharply: New York requires written notice of electronic monitoring to new hires, Connecticut and Delaware have their own notice obligations, and California's CCPA/CPRA treats employee data as personal information with disclosure and deletion rights attached. Wage-and-hour exposure under the FLSA is the practical risk — if a tracker shows work performed off the clock, that record cuts against you, so accurate overtime capture is a defensive asset rather than a nice-to-have.
India. No single omnibus privacy statute has historically governed workplace monitoring, but the Digital Personal Data Protection Act, 2023 introduces consent, purpose-limitation and notice obligations that apply squarely to employee data as it comes into force. Practical requirements are shaped more by sectoral and contractual demands — IT and BPO providers routinely monitor because client contracts and ISO 27001 or SOC 2 commitments require demonstrable controls. Shops and Establishments Acts vary by state and set the working-hours and overtime rules a tracker needs to reflect, and statutory attendance registers remain a real obligation.
Australia. The most prescriptive of the major APAC markets. New South Wales and the Australian Capital Territory require written notice at least 14 days before computer surveillance begins, and covert monitoring generally requires judicial authorisation. Fair Work record-keeping obligations dictate what you must retain regardless of the tool.
Singapore. The PDPA governs employee data, with notification obligations and a reasonableness standard. Monitoring is lawful with proper notice and a legitimate business purpose.
UAE and the Gulf. Federal Decree-Law No. 45 of 2021 sets the data protection baseline, with the DIFC and ADGM free zones operating separate and broadly stricter regimes modelled on GDPR. Free-zone entities frequently face tighter obligations than mainland ones.
The operational implication for anyone running a distributed team: configure tracking to the strictest regime you operate under rather than per-country. Multiple monitoring policies across one workforce are difficult to administer, impossible to explain simply, and tend to fail at exactly the moment they are tested. If you employ in NSW, the 14-day written notice standard is a reasonable global default.
Where AI Genuinely Changes Productivity Tracking
Most 'AI-powered' claims in this category describe classification that has existed for years. A few developments are real, and they are worth separating from the marketing.
Categorisation that adapts. Static rule lists break constantly — every new SaaS tool needs a rule, and the same application means different things to different roles. Models that classify from context and learn from corrections remove an administrative burden that caused most legacy deployments to drift into inaccuracy within months.
Anomaly detection instead of dashboard-watching. The useful inversion is a system that surfaces the exceptions — a project trending 40% over its time budget in week two, a support queue whose handling time is quietly climbing — rather than expecting a manager to spot them in a chart. This is what makes tracking data survive contact with a busy manager's calendar.
Vision-based attendance. Face-recognition clock-in removes buddy punching without the hygiene objections to fingerprint scanners, and it works for field and site-based teams where no fixed terminal exists. It also carries the heaviest compliance burden of anything in this article — Illinois' BIPA has produced substantial settlements, and biometric consent requirements are tightening across most of the markets above. Worth deploying deliberately, with explicit consent and a documented retention policy, or not at all.
Narrative summarisation. Turning a week of activity records into a plain-language account of where time went, which is materially more useful to a project lead than a chart they have to interpret.
What AI has not solved, and shows no sign of solving, is the fundamental gap: these systems observe activity, not value. A model can tell you a team spent 30% of its quarter in meetings with far better accuracy than a manual audit ever could. Whether those meetings were worth it remains a judgement call, and outsourcing that judgement to a productivity score is how organisations end up optimising for the appearance of work.
We cover the practical side of this in more depth in our guide to AI and computer vision for B2B productivity.
Want to See It in Action?
Explore how Track Nexus's AI-powered features can transform your team's productivity with a live demo.
Use Cases & Applications
Discover how organizations use this solution to improve their operations
Agencies and consultancies
Utilisation and effective hourly cost per client, so under-priced retainers surface during the quarter rather than at renewal.
IT and software teams
Focus ratio and interruption patterns across sprints, exposing fragmentation that velocity charts hide entirely.
BPO and support operations
Live queue visibility plus the audit trail client contracts and ISO 27001 or SOC 2 commitments require you to evidence.
Field and distributed teams
Location-verified attendance and offline capture that reconciles later, for work that never touches a fixed desk.
Frequently Asked Questions
Common questions about productivity tracker
How can I track my own productivity?
What is the formula for productivity?
What is a good productivity ratio?
Can my employer see what I am doing on my work computer?
What are examples of productivity software?
Do productivity trackers work for remote and hybrid teams?
Will tracking make my team more productive?
Explore More Insights
Continue learning with these related articles

Free Productivity Tracker: Get Started with Zero Cost
Not every team needs enterprise-grade analytics on day one. A free productivity tracker lets you start measuring work patterns, identifying time drains, and building data-driven habits without a budget conversation. The key is choosing a free tool that captures useful data from the start and provides a clear upgrade path when your needs grow beyond the basics.

Employee Monitoring Software: Ethical Oversight for Modern Teams
Employee monitoring software has evolved from simple keystroke loggers into comprehensive workforce analytics platforms. The global market reached $1.6 billion in 2025, driven by the permanent shift to hybrid work and the need for accountability without micromanagement. The best employee monitoring software balances organizational visibility with employee privacy, providing insights that help both managers and team members perform better.
How to Track Employee Hours Accurately: Methods Compared
Tracking employee hours accurately is not just an administrative necessity; it is the foundation of fair pay, compliant operations, and profitable project management. Yet many organizations treat it as an afterthought, relying on methods that introduce systematic errors and create downstream headaches. Consider the cost of inaccuracy. A 10-minute daily rounding error across 50 employees translates to roughly 2,000 lost hours per year. At an average fully loaded cost of $45 per hour, that is $90,000 in misallocated labor cost, either overpaying for hours not worked or underpaying employees who deserve compensation. Neither outcome is acceptable. This guide compares six common methods for tracking employee hours, from the simplest to the most sophisticated. For each method, we cover the actual accuracy you can expect, the administrative overhead, the cost, and the type of organization it best serves. The goal is to help you find the approach that delivers the accuracy your business needs without more complexity than you can manage.

Workplace Productivity Tools: Essential Software for Modern Offices
Workplace productivity tools encompass the full stack of software that helps teams work faster, communicate clearly, and track their output. The challenge is not finding tools but finding the right combination that works together without creating more administrative overhead than it eliminates. The average enterprise uses 371 SaaS applications, yet employee productivity has not increased proportionally.
Ready to Transform Your Productivity?
Join thousands of teams using Track Nexus to optimize their workforce productivity. Schedule a personalized demo today.